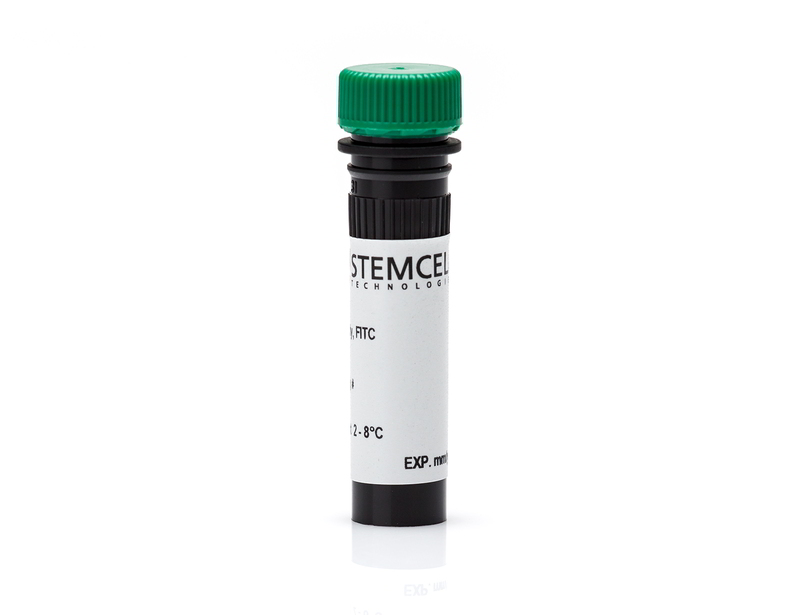
Anti-Human CD71 (Transferrin Receptor) Antibody, Clone OKT9
Data
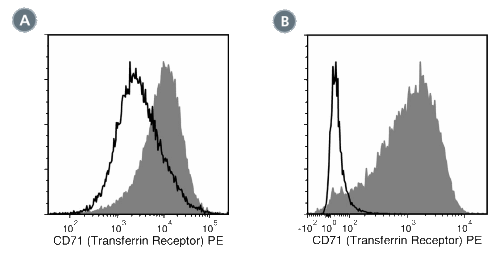
Figure 1. Data for Unconjugated
(A) Flow cytometry analysis of CD3+ cells (T cells) isolated from human peripheral blood mononuclear cells (PBMCs), then stimulated by incubation with anti-CD3 and anti-CD28 antibodies. Cells were labeled with Anti-Human CD71 (Transferrin Receptor) Antibody, Clone OKT9, followed by a rat anti-mouse IgG1 antibody, PE (filled histogram), or a mouse IgG1, kappa isotype control antibody followed by a rat anti-mouse IgG1 antibody, PE (solid line histogram).
(B) Flow cytometry analysis of CD3+ cells isolated from human PBMCs, then stimulated by incubation with anti-CD3 and anti-CD28 antibodies. Cells were labeled with Anti-Human CD71 (Transferrin Receptor) Antibody, Clone OKT9, which had been pre-incubated for 5 min with a rat anti-mouse IgG1 antibody, PE (filled histogram), or a mouse IgG1, kappa isotype control antibody, which had been pre-incubated for 5 min with a rat anti-mouse IgG1 antibody, PE (solid line histogram). Pre-incubating the primary and secondary antibodies helped minimize background binding of the secondary antibody to the anti-CD3 and anti-CD28 antibodies used for stimulating the cells.
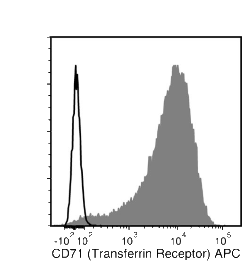
Figure 2. Data for APC-Conjugated
Flow cytometry analysis of CD3+ cells (T cells) isolated from human peripheral blood mononuclear cells (PBMCs), then stimulated by incubation with anti-CD3 and anti-CD28 antibodies. Cells were labeled with Anti-Human CD71 (Transferrin Receptor) Antibody, Clone OKT9, APC (filled histogram) or a mouse IgG1, kappa isotype control antibody, APC (solid line histogram).
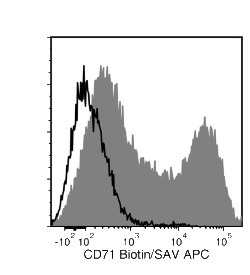
Figure 3. Data for Biotin-Conjugated
Flow cytometry analysis of CD3+ cells (T cells) isolated from human peripheral blood mononuclear cells (PBMCs), then stimulated by incubation with anti-CD3 and anti-CD28 antibodies. Cells were labeled with Anti-Human CD71 (Transferrin Receptor) Antibody, Clone OKT9, Biotin followed by streptavidin (SAV) APC (filled histogram), or a biotinylated mouse IgG1, kappa isotype control antibody followed by SAV APC (solid line histogram).
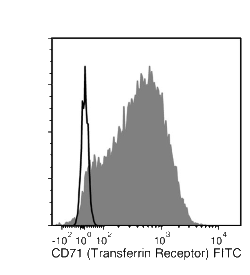
Figure 4. Data for FITC-Conjugated
Flow cytometry analysis of CD3+ cells (T cells) isolated from human peripheral blood mononuclear cells (PBMCs), then stimulated by incubation with anti-CD3 and anti-CD28 antibodies. Cells were labeled with Anti-Human CD71 (Transferrin Receptor) Antibody, Clone OKT9, FITC (filled histogram) or a mouse IgG1, kappa isotype control antibody, FITC (solid line histogram).
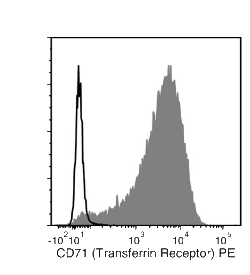
Figure 5. Data for PE-Conjugated
Flow cytometry analysis of CD3+ cells (T cells) isolated from human peripheral blood mononuclear cells (PBMCs), then stimulated by incubation with anti-CD3 and anti-CD28 antibodies. Cells were labeled with Anti-Human CD71 (Transferrin Receptor) Antibody, Clone OKT9, PE (filled histogram) or a mouse IgG1, kappa isotype control antibody, PE (solid line histogram).

